Recent publications regarding energy and how UK will achieve its Net Zero Carbon 2050 targets
| energy_white_paper_dec_2020.pdf |
How green is my energy?
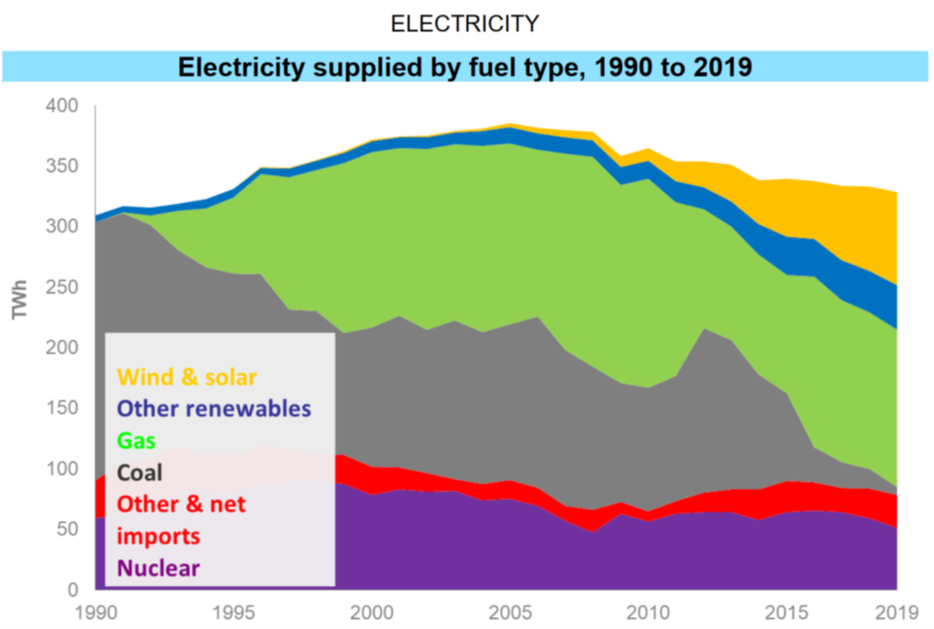
The carbon intensity of the UKs power has rapidly been decarbonising over the three decades (although there is still plenty of work to be done.) The following image from the UK Energy in Brief 2020 report (BEIS), shows how our electricity generation has moved from domination from coal, to a mix of gas, nuclear and renewables:
But did you know that the carbon intensity varies according to the time of day and geographic region- due to a variety of generation methods being used?
A new website has been developed by the National Grid ESO and partners, showing the carbon intensity at any given time- using a mixture of AI (artificial intelligence) and predictive weather data.
An example is shown here:
A new website has been developed by the National Grid ESO and partners, showing the carbon intensity at any given time- using a mixture of AI (artificial intelligence) and predictive weather data.
An example is shown here:
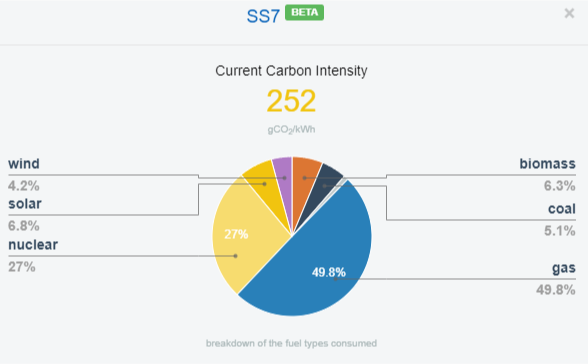
NOTE: the above data was for a winters day, with very little wind, although quite clear skies.
The website can also show the best times to try and use the energy:
The website can also show the best times to try and use the energy:
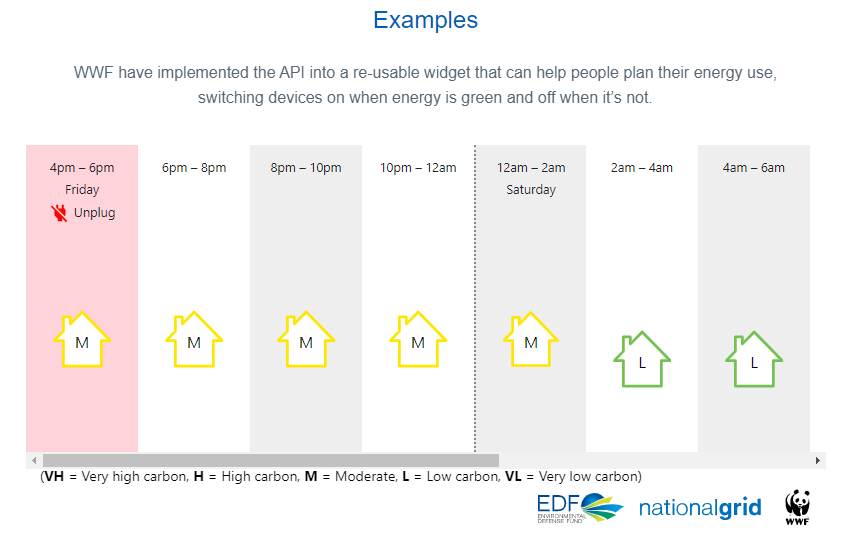
This useful tool can be found at: https://carbonintensity.org.uk/