Castlepoint Climate Action Group
  • Home
  • LINKS TO OTHER ORGANISATIONS
    • Active Essex
  • Local issues
    • Contact, News and Discussion >
      • Letter from Rebecca Harris
      • Q & A
      • CPCAG twitter feed
      • A members perspective
      • CPCAG Facebook Page
      • Contact us
      • Castle Point threats
      • Events
    • Blog
    • Climate Emergency
    • Castle Point News
  • About CPCAG
    • Mission Statement
    • CPCAG Meetings >
      • Minutes 2 Nov 2022
      • Minues Meeting 23 Feb 23
  • What Can I do to Help?
    • What can i do
    • Save Energy
    • Businesses
    • Resources
    • Climate Ambassadors >
      • What Will They Do?
      • POLICIES >
        • Privacy Notice
        • Constitution
        • Safeguarding
        • Political Impartiality
        • Public Liability Insurance
      • Why Do We Need Climate Ambassadors?
      • Application Form >
        • Resources for Climate Ambassadors >
          • Summary Carbon Calculator
          • How Can I Save a Tonne of Carbon?
          • Extreme Weather Events 2021
          • Extreme Weather Events 2022
          • Extreme Weather Events 2023
          • UK Extreme Weather Events
      • Resources Created By Young People
  • Climate Change information
    • Carbon footprint calculator
    • Climate Science
    • Reports and Information >
      • US Census Bureau Report 2022
    • Education
    • Energy >
      • Solar Together Scheme
      • UK energy carbon intensity

Extreme Weather Events 2023


​A list of extreme events in date order.

​Every effort has been made to make the list comprehensive

​ but it is not claimed to be exhaustive.
​
​Warning: It does not make easy reading!
​
​
​Note: Between 2001 and 2010 the total cost of extreme

weather events across the world was, on average,

approximately $168bn per year. Between 2011 and 2020 this

rose to $248bn per year.

In 2021 the total cost was estimated at £320bn and in 2022 it

​ was estimated at $270bn.
Picture
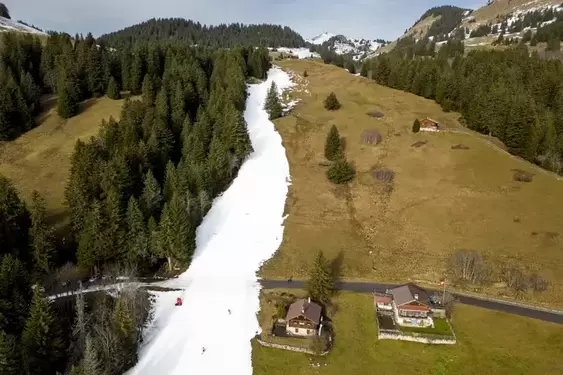
January - Record Heatwave across Europe 

At the very start of the month a heatwave hit Europe with thousands of new winter temperature records being set. For example, Spain set a new record of 25.1 degrees C. In Warsaw, Poland, a new January record temperature of 18.9 degrees C was set which was a staggering 5.1 degrees higher than the previous record.
The extreme heat had a serious impact on ski slopes, many of which had to shut.


​

Picture
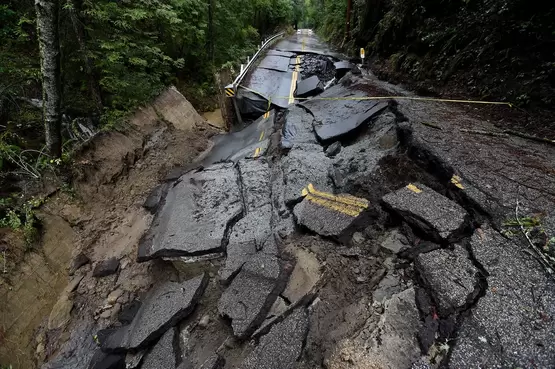
January - Floods in California

After years of drought, California was hit by an "atmospheric river" which is a series of storms that bring sustained rainfall over an extended period.
In San Francisco as much as 35cm of rain fell in 2 weeks. On higher ground there was heavy snowfall, with 480cm falling on Mammoth Mountain.
The rain caused over 500 land slips, some of which caused road closures and heavy winds brought down trees which caused power outages which affected over 200,000 homes. 6,000 homes were forced to evacuate and there were at least 19 fatalities.
The Governor announced a state of emergency.


Picture
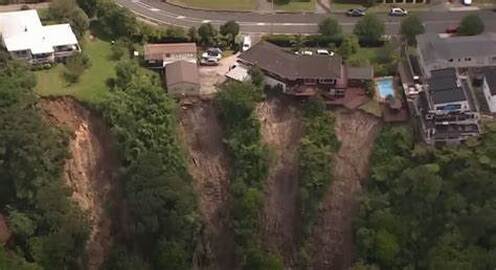
​January - Floods in New Zealand

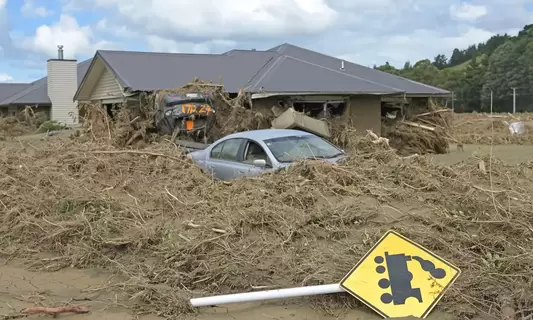
There was heavy rainfall centred on the Aukland area. Up to 400mm (over 15 inches) fell in 3 days and was the worst in modern history.
​There was widespread damage and disruption. Schools were closed for a week, many roads were blocked and there were power cuts to 26,500 homes and businesses. 5,000 houses suffered damage and there were at least 4 fatalities and countless loss of livestock.


Picture
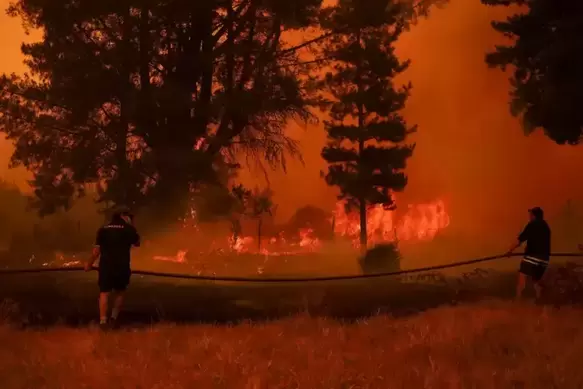
February - Wildfires in Chile

High temperatures (over 40 degrees) and years of drought has led to a particularly severe wildfire season in Chile.
Fires affected over 2700 square kilometres which was the 2nd most destructive season on record. There have been 26 deaths reported with 2000 injured. 1000 homes have been destroyed.
The fires were fought by over 6000 fire fighters and 70 planes and helicopters.
​The fires were exacerbated by the planting of non-native trees for timber which provided more fuel for the fires.


Picture
February - New Zealand - Cyclone Gabrielle

Cyclone Gabrielle brought strong winds that caused extensive damage, heavy rain, flooding and land slips. It was described by officials as an "unprecedented natural disaster". Winds of 100 kph were widespread and there were gusts of 160 kph and rain fell at a rate of up to 20mm per hour.
​It mostly impacted upon the North Island but it led to the government declaring a National State of Emergency for just the 3rd time in the country's history. The previous two were for the Christchurch earthquake and Covid. It was the worst storm to hit New Zealand since Cyclone Bola in 1988. It followed on from damaging floods that they had experienced only a couple of weeks previously. 

It is estimated that at least a third of the North Island's 5 million population was affected. 62,000 homes lost power and more than 10,000 people were displaced by the floods. There were at least 9 fatalities. 


Picture
February - East Africa - Cyclone Freddy

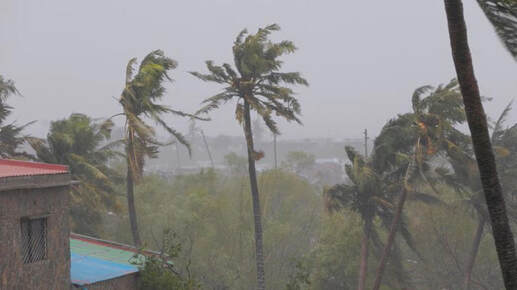
Cyclone Freddy was the most energetic storm in history. It has been claimed that this one storm released more energy than all the hurricanes that affect the USA in a whole season.

Not only was it a very strong storm, a category 5 Cyclone, with winds as high as 165 mph  (270 kph) but it was also the longest lasting in history. It formed on 4 February and did not finally dissipate until 15 March, a total of 39 days!


Picture
​The storm formed in the Timor Sea, just north of Australia, and travelled across the Indian Sea gaining strength as it went. Normally, when storms hit land they start to weaken but Cyclone Freddy reversed direction and moved back over the Mozambique straight which meant that it was re-energized.

Freddy was the first storm ever to have had 7 cycles of intensification and only the 4th storm to have travelled all the way across the Indian Ocean.

Storm Freddy affected a number of East African countries: Malawi; Madagascar; Mozambique; Reunion; Mauritius; Zimbabwe. As the storm changed course, some of these countries were hit more than once. 

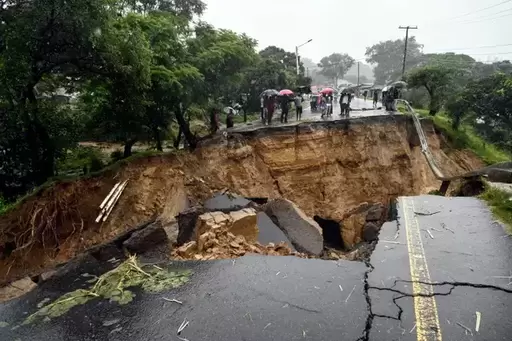
Overall, there have been more than 300 fatalities with more than 50 people missing. Lots of injuries have been reported, mostly in Malawi, and over 600,000 people affected by losing power or being displaced. Many areas experienced very heavy rainfall, as much as 500mm, and so there was widespread flooding. International Aid agencies are setting up temporary shelters.

In Madagascar 5,500 homes were destroyed and another 9000 damaged or flooded. 300,000 people were affected, many of whom were still recovering from Cyclone Batsirai.

​There was a great deal of damage to infrastructure with roads, bridges and schools being damaged and there was significant loss to agriculture. Many people had their power cut off, particularly in Malawi where the whole nation shut down their electricity generation to avoid the storm causing damage to their machines!

Proudly powered by Weebly
  • Home
  • LINKS TO OTHER ORGANISATIONS
    • Active Essex
  • Local issues
    • Contact, News and Discussion >
      • Letter from Rebecca Harris
      • Q & A
      • CPCAG twitter feed
      • A members perspective
      • CPCAG Facebook Page
      • Contact us
      • Castle Point threats
      • Events
    • Blog
    • Climate Emergency
    • Castle Point News
  • About CPCAG
    • Mission Statement
    • CPCAG Meetings >
      • Minutes 2 Nov 2022
      • Minues Meeting 23 Feb 23
  • What Can I do to Help?
    • What can i do
    • Save Energy
    • Businesses
    • Resources
    • Climate Ambassadors >
      • What Will They Do?
      • POLICIES >
        • Privacy Notice
        • Constitution
        • Safeguarding
        • Political Impartiality
        • Public Liability Insurance
      • Why Do We Need Climate Ambassadors?
      • Application Form >
        • Resources for Climate Ambassadors >
          • Summary Carbon Calculator
          • How Can I Save a Tonne of Carbon?
          • Extreme Weather Events 2021
          • Extreme Weather Events 2022
          • Extreme Weather Events 2023
          • UK Extreme Weather Events
      • Resources Created By Young People
  • Climate Change information
    • Carbon footprint calculator
    • Climate Science
    • Reports and Information >
      • US Census Bureau Report 2022
    • Education
    • Energy >
      • Solar Together Scheme
      • UK energy carbon intensity