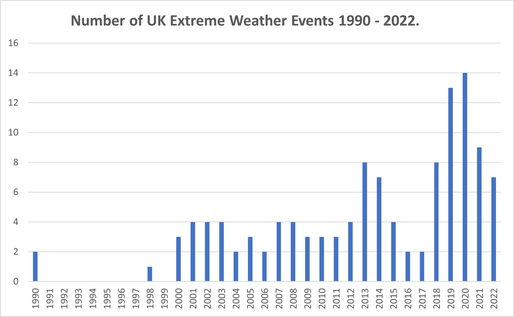
This chart illustrates the number of extreme weather events recorded by the Meteorological Office since 2000. As you can see, the number of extreme events appears to have increased in recent years.
These extreme events fall into a number of different categories: storms; record high temperatures; record rainfall; drought.
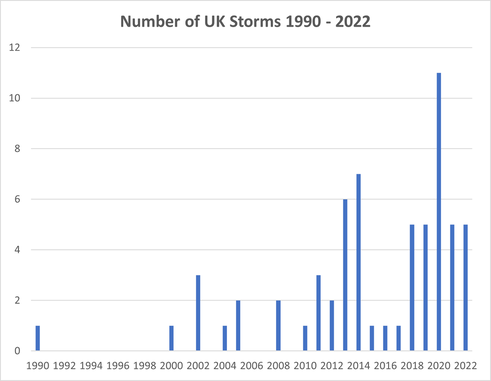
It is clear that the number of storms experienced in the UK has also increased in the UK in the last few years.
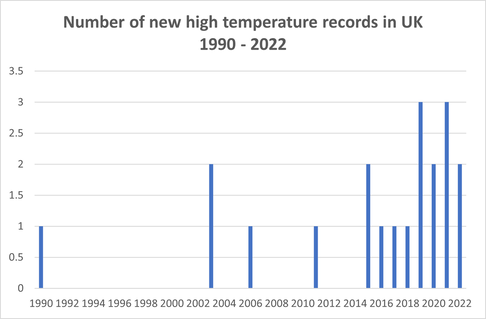
Equally, the number of new record high temperatures has increased in the last few years.
Note: The met office includes periods of high temperatures in their list of extreme events, even if they do not break a record. This chart includes only events that set a new record for at least 50 years.
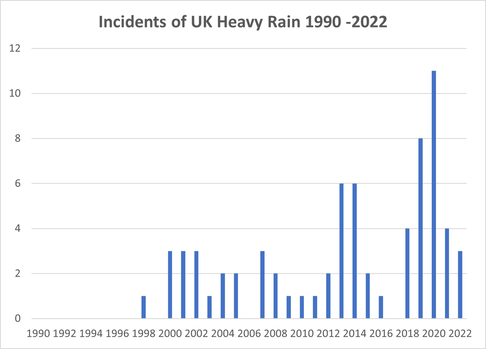
There is a similar pattern with incidents of heavy rainfall which have become more common in the last decade.
Click here for the list of extreme weather events recorded by the UK Meteorological Office, along with links to full details of each event.